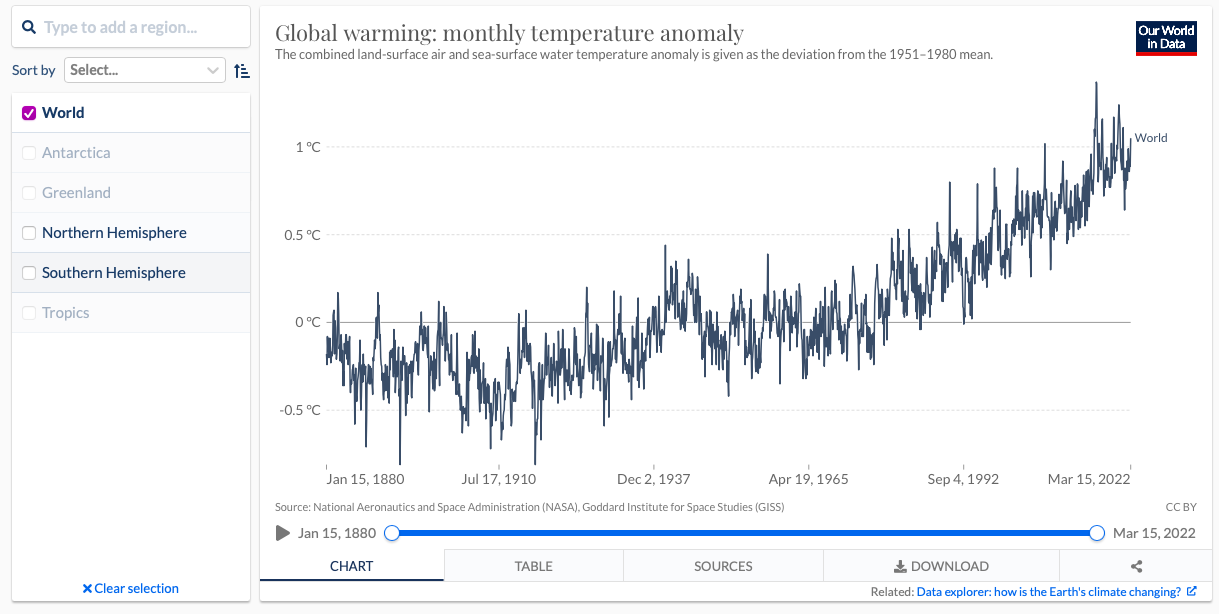
I downloaded Climate Change Impacts data from Our World in Data. I selected this data because I am interested in climate change and the effect it is having on our world from 1965 to 2021.
This is the link to the data.
The following code chunk loads the packages I will use to read in and prepare the data for analysis.
- Read the data in
- Use glimpse to see the names and types of the columns
glimpse(climate_change)
Rows: 10,085
Columns: 20
$ Entity                                  <chr> "Antarctica", "Antar…
$ Date                                    <date> 1992-01-01, 1992-01…
$ `Combined measurements`                 <dbl> NA, NA, NA, NA, NA, …
$ `Seasonal variation`                    <dbl> 418.3103, 425.3770, …
$ `Monthly averaged...5`                  <dbl> NA, NA, NA, NA, NA, …
$ `Annual averaged...6`                   <dbl> NA, NA, NA, NA, NA, …
$ monthly_sea_surface_temperature_anomaly <dbl> NA, NA, NA, NA, NA, …
$ `Sea surface temp (lower-bound)`        <dbl> NA, NA, NA, NA, NA, …
$ `Sea surface temp (upper-bound)`        <dbl> NA, NA, NA, NA, NA, …
$ `Monthly pH measurement`                <dbl> NA, NA, NA, NA, NA, …
$ `Annual average`                        <dbl> NA, NA, NA, NA, NA, …
$ `Temperature anomaly`                   <dbl> NA, NA, NA, NA, NA, …
$ `Church & White`                        <dbl> NA, NA, NA, NA, NA, …
$ `University of Hawaii`                  <dbl> NA, NA, NA, NA, NA, …
$ Average                                 <dbl> NA, NA, NA, NA, NA, …
$ arctic_sea_ice_osisaf                   <dbl> NA, NA, NA, NA, NA, …
$ `Monthly averaged...17`                 <dbl> NA, NA, NA, NA, NA, …
$ `Annual averaged...18`                  <dbl> NA, NA, NA, NA, NA, …
$ `Monthly averaged...19`                 <dbl> NA, NA, NA, NA, NA, …
$ `Annual averaged...20`                  <dbl> NA, NA, NA, NA, NA, …
# View(climate_change)
- Use output from glimpse to prepare the data for analysis.
Change the name of the first column to Region and the 12th column to Temperature_anomaly
Use filter to extract the rows that I want to keep: Date >= 1965-01-15 and Region equals World
Select the columns to keep: Region, Date, Temperature_anomaly
Assign the output to monthly_temperature_anomaly
Display the first 10 rows of monthly_temperature_anomaly
monthly_temperature_anomaly <- climate_change %>%
  rename(Region = 1, Temperature_anomaly = 12) %>%
  filter(Date >= "1965-01-15", Region == "World") %>%
  select(Region, Date, Temperature_anomaly)

monthly_temperature_anomaly
# A tibble: 1,495 × 3
   Region Date       Temperature_anomaly
   <chr>  <date>                   <dbl>
 1 World  1965-01-15               -0.08
 2 World  1965-02-15               -0.17
 3 World  1965-03-15               -0.13
 4 World  1965-04-15               -0.19
 5 World  1965-05-15               -0.12
 6 World  1965-06-15               -0.08
 7 World  1965-07-15               -0.13
 8 World  1965-08-15               -0.04
 9 World  1965-09-15               -0.15
10 World  1965-10-15               -0.05
# … with 1,485 more rows
Add a picture
Write the data to file in the project directory.
write_csv(monthly_temperature_anomaly, file = "monthly_temperature_anomaly.csv")